This text updates the sixth edition to reflect the many changes that have taken place in the last three years to the responsibilities of treasury management professionals.
Here’s some of what’s new in the 20 chapters of the seventh edition:
As with any publication, there are errors found after printing. An Errata will be posted once errors are reported.
2023-2025 CTP Exam Knowledge Domains
I. Maintain corporate liquidity required to meet current and future obligations in a timely and cost-effective manner.
II. Manage capital structure, manage costs of long-term capital and quantitatively evaluate long-term capital resource investments.
III. Manage internal and external relationships.
IV. Monitor and control corporate exposure to financial, regulatory and operational risk (including emerging and reputational risk).
V. Assess impact of technologies on the treasury function.
Introduction to Study of Treasury Management
Learn more.
I. Introduction
II. The Evolving Role of the Treasury Professional
III. Organization of Essentials of Treasury Management
IV. Notes on Conventions Used in this Book
V. Summary
Chapter 1: The Role of Treasury Management
Learn more.
I. Introduction
II. The Role and Organization of Treasury Management
III. Finance and Treasury Organization
IV. Corporate Governance
V. Summary
Chapter 2: Legal, Regulatory and Tax Environment
Learn more.
I. Introduction
II. General Regulatory Environment
III. Financial Regulatory Regime
IV. National Approaches to Legislation and Regulation
V. Tax Considerations for Treasury
VI. Bankruptcy/Insolvency Laws
VII. Trends in Regulation
VIII. Summary
Appendix 2.1: Bankruptcy Procedures
Chapter 3: Banks and Financial Institutions
Learn more.
I. Introduction
II. Banks
III. Nonbank Financial Institutions: Functions and Services
IV. Fiduciaries
V. Summary
Chapter 4: Payment Instruments and Systems
Learn more.
I. Introduction
II. Payment Overview
III. Payment Instruments
IV. Payment Systems
V. Payment Regulation
VI. Summary
Appendix 4.1: Check Return Reasons
Appendix 4.2: Sample US Business Check
Appendix 4.3: US ACH Standard Entry Class (SEC) Codes and Payment Types
Appendix 4.4: Most Common NACHA Return Reasons Codes
Appendix 4.5: Banking and Payment Systems Information for Selected Countries
Chapter 5: Money Markets
Learn more.
I. Introduction
II. Money Market Participants
III. Money Market Instruments
IV. Summary
Chapter 6: Capital Markets
Learn more.
I. Introduction
II. Structure of the Capital Markets
III. Debt Market
IV. Equity Market
V. Summary
Appendix 6.1: Listing of the World’s Top Stock Exchanges
Chapter 7: Capital Markets Relationship Management and Financial Service Provider (FSP) Selection
Learn more.
I. Introduction
II. Bank Relationship Management
III. FSP Selection
IV. Assessing the Risk of FSPs
V. Summary
Appendix 7.1: Sample RFP Design – Global Treasury Services "
Chapter 8: Financial Accounting and Reporting
Learn more.
I. Introduction
II. Uses of Financial Statements
III. Accounting Concepts and Standards
IV. Financial Statement Reporting
V. Accounting for Derivatives, Hedges, and Foreign Exchange (FX)
VI. Accounting for Governmental and Not-For-Profit (G/NFP) Organizations
VII. Summary
Chapter 9: Financial Planning and Analysis
Learn more.
I. Introduction
II. Time Value of Money
III. Capital Budgeting
IV. Budgeting
V. Cost Behavior
VI. Financial Statement Analysis
VII. Summary
Chapter 10: Introduction to Working Capital Management
Learn more.
I. Introduction
II The Link Between Cash and Working Capital
III. Components of the Capital Cash Conversion Cycle (CCC)
IV. How Changes in Current Balance Sheet Accounts Impact External Financing
V. Strategies for Investing In and Financing Working Capital
VI. Management of Trade Credit and Accounts Receivable (A/R)
VII. Management of Inventory
VIII. Management of Accounts Payable (A/P)
IX. Working Capital Management Tools for Corporate Groups
X. Summary
Chapter 11: Working Capital Metrics
Learn more.
I. Introduction
II. Fundamental Working Capital Metrics
III. The Cash Conversion Cycle (CCC)
IV. Calculations for Trade Credit Decisions
V. Accounts Receivable (A/R) Monitoring
VI. Summary
Chapter 12: Disbursements, Collections and Concentration
Learn more.
I. Introduction
II. Disbursements
III. Collections
IV. Concentration of Funds
V. Summary
Chapter 13: Short-Term Investing and Borrowing
Learn more.
I. Introduction
II. Managing Short-Term Investments
III. Pricing and Yields on Short-Term Investments
IV. Managing Short-Term Borrowing
V. Debt Financing
VI. Market Information for Investors and Borrowers
VII. Summary
Appendix 13.1: Selected LIBOR Replacement Risk-Free Rates
Appendix 13.2: Listing of Some Major Credit Rating Agencies
Chapter 14: Cash Flow Forecasting
Learn more.
I. Introduction
II. Purpose of Cash Flow Forecasting
III. Types of Forecasts
IV. Forecasting Process
V. Forecasting Methods
VI. Best Practices for Cash Flow Forecasting
VII. Summary
Chapter 15: Technology in Treasury
Learn more.
I. Introduction
II. Information Technology for Treasury
III. Treasury Management Systems (TMSs)
IV. Project Management
V. Communications and Technology Developments
VI. Summary
Appendix 15.1: Outline of Different Electronic Message Types
Chapter 16: Enterprise Risk Management
Learn more.
I. Introduction
II. Risk Management
III. Categories of Risk
IV. Techniques Used to Measure Risk
V. Managing Insurable Risks
VI. Disaster Recovery and Business Continuity
VII. Summary
Appendix 16.1; Types of Insurance Coverage
Appendix 16.2: Disaster Recovery Checklist
Chapter 17: Financial Risk Management
Learn more.
I. Introduction
II. Types of Financial Risk
III. Managing Financial Risk
IV. Derivative Instruments as Financial Risk Management Tools
V. Managing Interest Rate Exposure
VI. Managing Foreign Exchange (FX) Exposure
VII. Managing Commodity Price Exposure
VIII. Accounting and Tax Implications of Financial Risk Management
IX. Regulation of Financial Instruments
X. Hedging Policy Statement
XI. Summary
Chapter 18: Treasury Policies and Procedures
Learn more.
I. Introduction
II. Overview of Treasury Policies and Procedures
III. Creating a Treasury Policy Document
IV. Overview of Key Treasury Policies
V. Summary
Appendix 18.1: Sample Short-Term Investment Policy
Chapter 19: Long-Term Investments
Learn more.
I. Introduction
II. Valuation of Capital Market Securities
III. Managing Capital Market Investments
IV. Summary
Chapter 20: The Capital Structure Decision and Management
Learn more.
I. Introduction
II. Capital Structure
III. Raising Long-Term Capital
IV. Managing Long-Term Capital
V. Alternative Financing
VI. Summary
Essentials of Treasury Management, 7th edition, Chapter 9: Financial Planning and Analysis
This section describes the different types of costs, break-even analysis, and leverage (i.e., operating, financial, and total). These topics aid managers in determining the risks and returns associated with existing operations and future investment opportunities.
A. Types of Costs
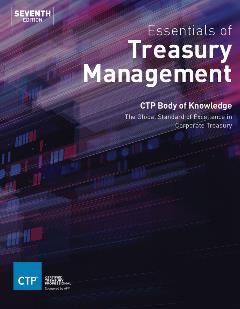
Financial planning and analysis requires an understanding of cost behavior. Cost behavior describes the relationship between costs and cost drivers, defined as business activities that influence costs. Costs are classified as either fixed, variable or step-up.
Each type is described as below:
Exhibit 9.7 displays the behavior of these types of costs in relation to production output. Note that the level of fixed costs does not vary with production volume (i.e., the fixed cost curve has no slope). Meanwhile, the positive slope of the variable cost curve indicates that variable costs increase with production output. The step-up cost curve increases in a stair-step fashion. Lastly, the total cost curve is the sum of each cost component for a given level of production.
B. Break-even Analysis
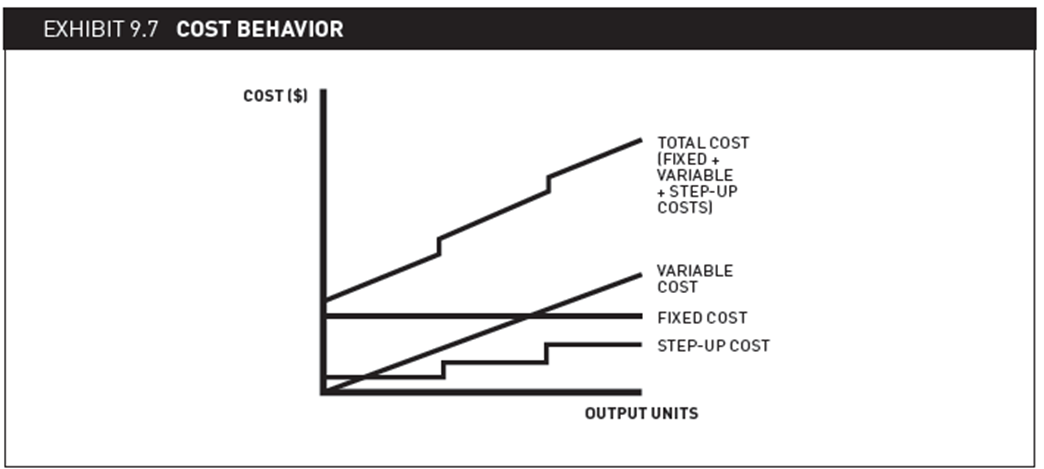
Break-even analysis involves calculating the level of sales required to earn an operating profit of $0. This quantity is referred to as the break-even quantity.
Exhibit 9.8 provides a graphical illustration of the break-even concept. To simplify the graph, the step-up cost curve is omitted (both on its own and as part of the total cost curve), and the variable cost curve is only included as part of the total cost curve. The graph also includes a revenue curve. The slope of the revenue curve is steeper than the total cost curve, which results from the markup earned on each unit sold. The point of intersection between the total revenue and total cost curves represents the break-even quantity of sales. At a sales level above the break-even quantity, an operating profit is earned, as shown by the vertical distance between the revenue and total cost lines.
The break-even quantity can be calculated using estimates of the fixed costs, the per-unit sales price, and the variable cost per unit. A general formula appears below:

The denominator of the formula is commonly referred to as the contribution margin, which represents the component of the sales price that offsets fixed costs.
An example will help illustrate the concept. Suppose that management is considering entering into a new product line that will require $10,000 in fixed costs. Each unit sold will also result in $6 in variable costs. Further, each unit will sell for $10. The break-even quantity is calculated as:

The calculation indicates that the product line will earn an operating profit of $0 at a sales volume of 2,500 units. This calculation can be verified by checking that the operating profit equals $0 at a sales level of 2,500 units. If the firm sells more than 2,500 units, operating profit will expand by the contribution margin of $4 per unit.
Break-even analysis is quite helpful in financial planning and analysis. If management believes that future sales from a product line will fall below the break-even volume, then it would be advisable to avoid continuing with the product line. There are also numerous applications for break-even analysis in treasury management. One example is the calculation of the break-even amount of funds transferred that would justify a wire transfer versus an automated clearinghouse (ACH) network transfer. 14

See what’s in store at the treasury and finance conference, AFP 2024, October 20-23, in Nashville. Check out the Session Explorer here.